Thursday, April 24, 2014

How to turn on-screen interactive help ON/OFF

The on-screen interactive help to set to ON by default to help new users for first times of using "Math Graphics and Analytic" app:


On-screen interactive help

Users can use a settings tools to turn on-screen interactive help OFF or turn it ON if needed later:

Setting tools

On the settings screen, simply choose YES/NO options for "Show on-screen help" item:

Change option for "Show On-Screen Help" item


Wednesday, April 23, 2014

How to input graph function

When the application launched the default function (polynomial or fraction of polynomials) are created automatically as demo function. Users can use the input tools to input their-own functions.

Input/Update Graph function
Touch on the "abc" circle to show input screen

Input screen

Use number keyboard on the bottom of the screen to input coefficients of polynomial or tap on menu bar above the keyboard to change the leading degree of the polynomial.

Input polynomials with form: p(x) = q(x) . (x - x1)...

This input form is useful when one or more roots of the polynomial are known:

p(x) = q(x).(x-x1)...

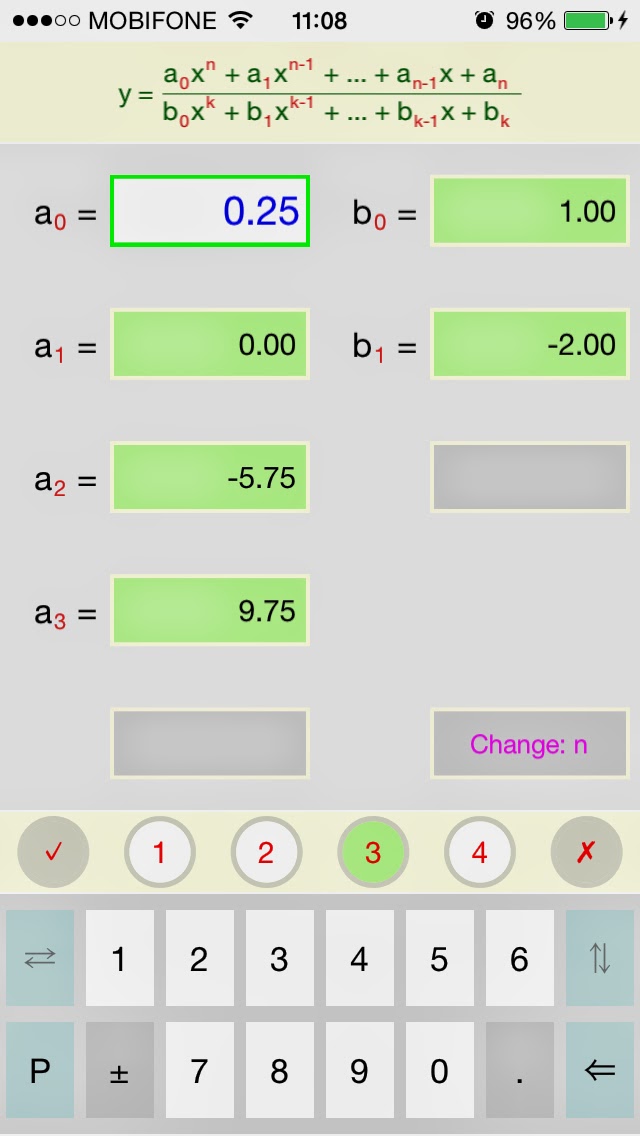
Input/Update fraction of polynomials

Input/Update fraction of polynomials


Working with graph: attaching objects to the graph (full-featured only)

Objects (tangent line, root's points, inflection point, extreme points,...) can be attached to the graph so that they not be disappeared. This feature is supported by the full-featured package only.

Touch on the "+" green circle on top of the graph area to attach shown objects to the graph and touch on the "-" circle to remove an attached objects.

Attach/Remove objects

The attached objects will be drawn together with the graph in output picture. 

Friday, April 18, 2014

Working with the graph: add a line as second graph

Adding a line as a second graph is useful when you study a relationship between function y = f(x) and line (function) y = ax + b. The app provides tools to do that:

1) Add/Remove a line
2) Change a line by moving and/or rotating a line
3) Shows intersection points between the two graphs
4) Solve the equation f(x) = ax + b and output the results
5) Attach the line & intersections to the graphs (full-featured version only)

Add a line to the graph

How to add a line as a second graph?

When you are working with one of the provided packages (polynomials, fraction of polynomials or ellipses), the sub-menu will appeared as on the following picture:

sub-menu to work with added line
When you touch on the "line" circle, the line automatically added to the graph. Tap on one of the green circles to show intersection points, move, rotate or remove it.

The "info" circle is to show the main information of the graph, including x-values of the intersection points (i.e. roots of equation f(x) = ax + b).


How to change background colour of the graph

The last item of the coordinates system sub-menu is to change background colour of the graph. There are 6 colors to choose:

Change background colour of the graph
Just tap and choose what is your favourite colour!

How to change x-scale/y-scale of the coordinates system

Different x-scale/y-scale of the coordinates system makes different looks of the graph of the same function. The following pictures show the graph of the same polynomial with two different values of x-scale:

Graph with bigger x-scale

Graph with smaller x-scale
Sometimes you need to change x-scale or y-scale to make the graph more appropriated for your requirements. Touch on the "x-scale" or "y-scale" circle to do that:

Tap on the green circle to change x-scale
There are 6 options of the scales from the smallest "+" to the biggest "++++++", simply touch to choose!


How to change the origin of the coordinates system

How to change the origin of the coordinates system

By default, the origin of the coordinates system is set to the center of graph's area. Users can change this settings, using the first toolset of the app.

The coordinates system toolset
With the coordinates system toolset you can:

1) Change the origin of the coordinates system or the position of x-axis/y-axis lines
2) Change the scale of the graphs
3) Change the color of the background of the graph

To do the above changes, simply touch on the respective sub-menu.

Change the origin of the coordinates system

Touch on the "move" circle, the vertical sub-menu will apeared as in the following picture:

sub-menu to change the origin of the coordinates system
Touch on one of the green circles and move finger on the graph area to: move the origin, the x-axis or the y-axis line.  

Wednesday, April 2, 2014

About Math Graphics and Analytic Geometry

This app turn your iPhone, iPad, iPod touch into a powerful toolset for learning and studying mathematical functions and graphics. Currently, there are 3 types of functions are provided:

1) Polynomials
2) Fraction of polynomials
3) Ellipses
Long division of polynomials
Drawing graphs

1) With graph drawing feature user can change the coordinates system as needed: change the background colour of graph, change the origin of the system, change position of x-axis or y-axis or change values of x-scale and/or y-scale of the system.

2) Detect and draw roots points, extreme points, inflection points, tangent lines, intersection points of the graph with a given line,...
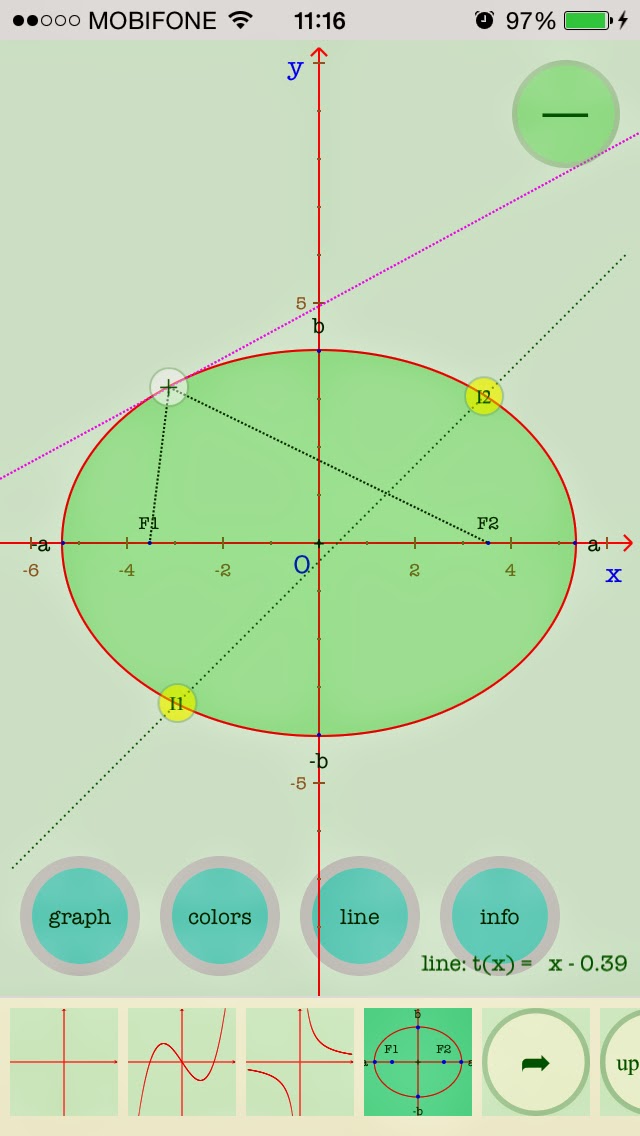
Tangent line to ellipse and intersections with given line
3) Draw the area which is bordered by lines x = x1, x = x2, x-axis and the graph. Calculate integral of the function in interval [x1, x2] and the area under/over x-axis.
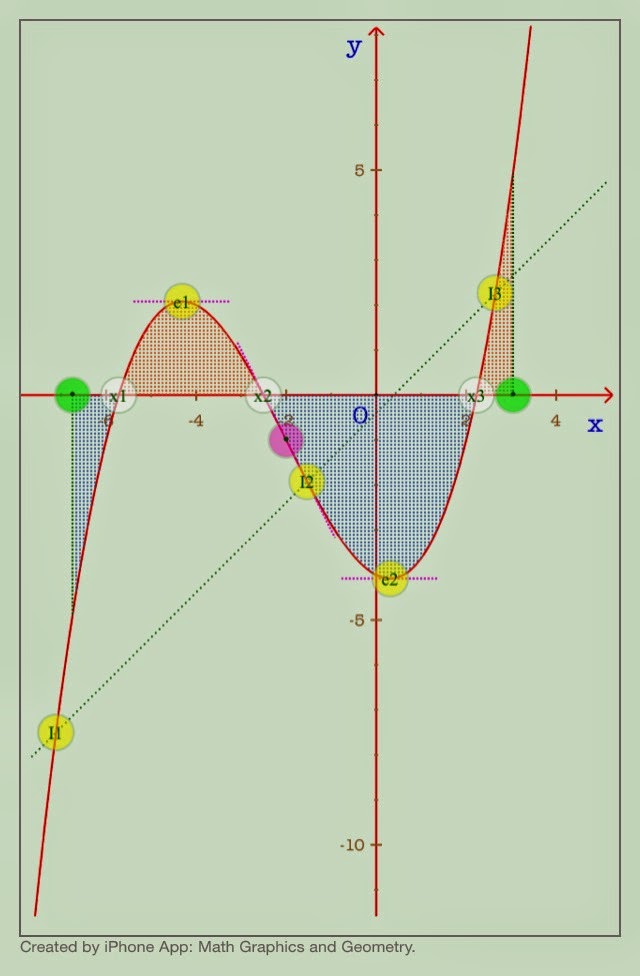
Integral of polynomials

Analysing and calculating

The following picture shows the output of analysing and calculating of the function and graphs:
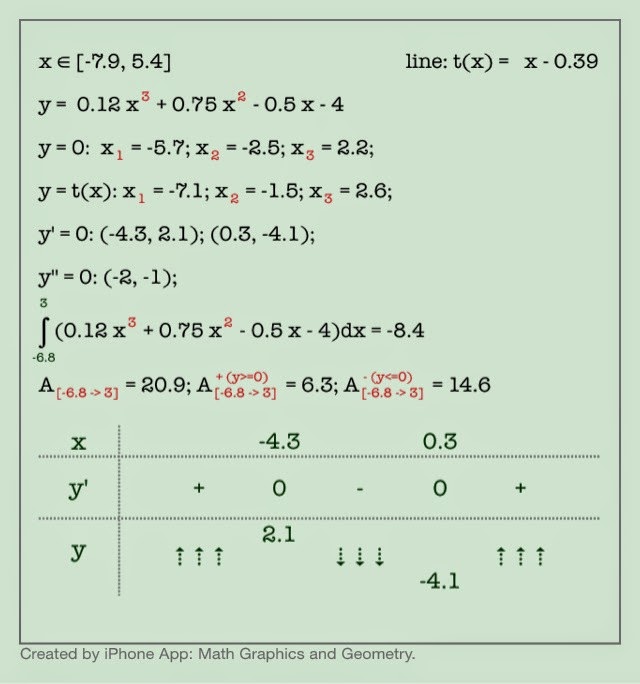
Analysing function and graph


Special tools for inputing parameters

Input function parameters/coefficients
Saving and sharing results

User can save the result as an image or share it by e-mail, facebook, twitter:

Saving and sharing the output


Currently the app runs on devices with iOS 7.0 or later
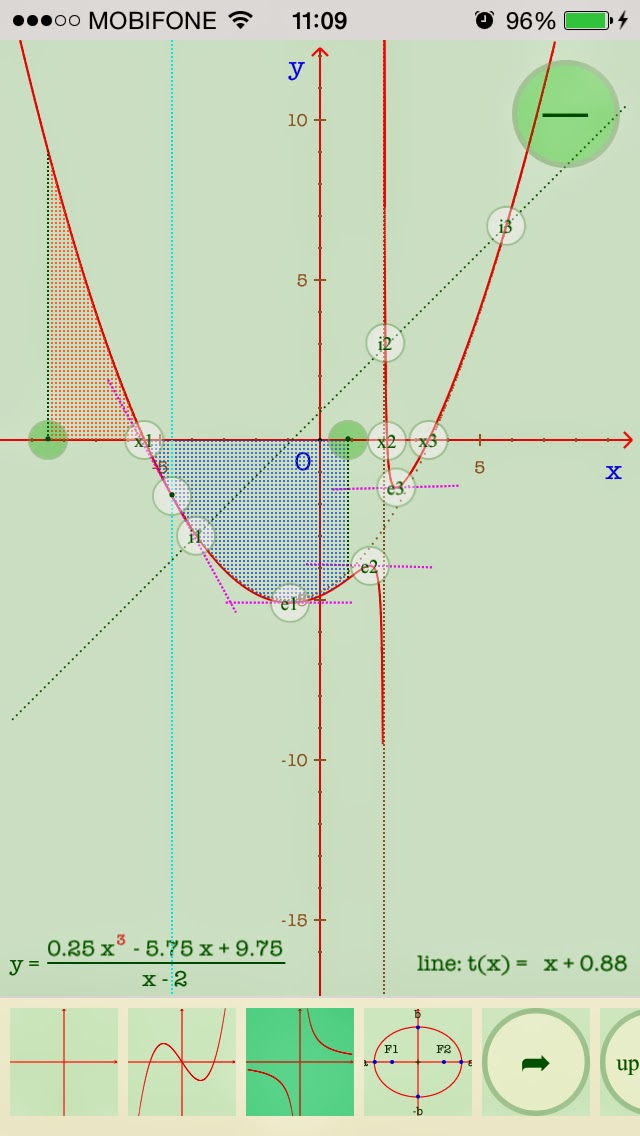
Analysing & calculation


Basic version and full-featured versions of products' packages

The basic versions of above packages are FREE. The full-featured version of each packages provides advanced functionalities such as:

1) Allow to work with higher degrees of polynomials
2) Allow to attach related objects like: roots points, extreme points, inflection points, tangent lines,... to the graph.
3) Remove adds when user works with the full-featured package. If user purchased two or more full-featured packages, all adds will be removed.
Input coefficients for fraction of polynomials